
 The most popular bet in football is backing one of the two sides to win a particular match.
The match odds, also known as home/away/draw, is the market that attracts by far the most money but relatively little of that goes on the draw. It is human nature to want to back a side to win, rather than to bet on the outcome where neither side prevails and the spoils will be shared.
It is widely accepted that the draw is almost always a great result for bookmakers, quite simply because so few punters choose to back it. If the Premier League sees an unusually high number of draws in a given season this almost always gives the UK bookies a tidy boost.
But just how often do football matches end in a draw?
What Proportion Of Matches End in a Draw?

The percentage of football matches that end in a draw varies depending on the competition, whilst the stats have also changed over time. As such we cannot give an answer that is both simple and accurate, but if it is a simple answer you are seeking – accurate or otherwise – then you should probably work on around 25% games of ending in draws.
The excellent stats and probability site FiveThirtyEight analysed data from 126 years of English football. They assessed the results of almost 200,000 games from 1888 to 2014 in the top four tiers of the English pyramid.
Out of 188,060 matches 47,412 ended with no winner. That equates to a percentage of 25.21 of English league matches ending in draws. That figure is far from the whole story though, and over the years that percentage has varied significantly.
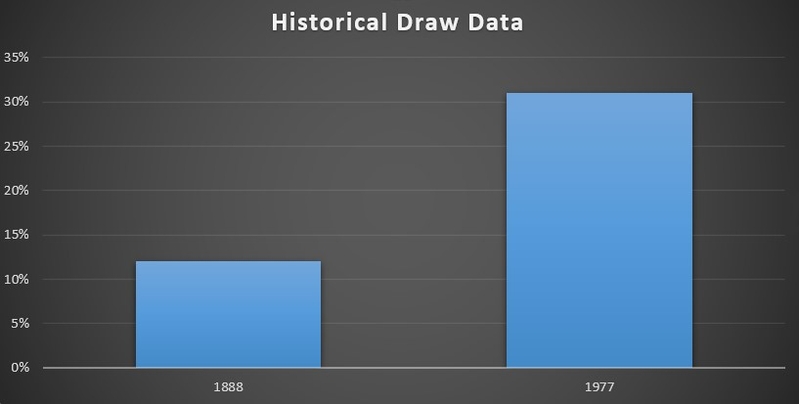
In 1890 a mere 12% of clashes ended with a draw, whilst in the 1970s the percentage was routinely in the high 20s, peaking at 31% (626 out of 2,025) in 1977. The main reason for a historic increase in draw frequency is that the average number of goals per game has decreased. In the earliest years of the Football League, matches averaged a whopping 4.5 goals per game.
For the majority of seasons from 1888 until the mid-1960s, the average was higher than three goals per match. However, from a very respectable average of almost 3.5 goals per game in 1960 we saw a steady decline, and from the late 1960s onwards no season has seen more than three goals per game on average, with a range of 2.5 to 2.8 fairly typical in the 50 or so years since.
When there are more goals, there are fewer draws, with 0-0s and 1-1s far less likely; various changes over the years have contributed to a decrease in the number of goals we have seen. These include, but are not limited to, changes to the offside rule, the introduction of substitutions, the introduction of red and yellow cards, and a move to a more tactical, organisation-based style of football.
Since the high mark for draws in 1977 we have never seen more than 30% of matches ending with a stalemate. From the late 1970s the rate of draws has been very steady, with between 29% and 24% of league contests ending with the spoils shared.
As said, the data above only takes us to 2014 but little has changed since then. The table below shows the number of draws in the Premier League for each season from 2014-15 to 2019-20.
| Season | Number of Games | Number of Draws | Draw Percentage |
|---|---|---|---|
| 2014-15 | 380 | 93 | 24.48 |
| 2015-16 | 380 | 107 | 28.16 |
| 2016-17 | 380 | 84 | 22.11 |
| 2017-18 | 380 | 99 | 26.05 |
| 2018-19 | 380 | 71 | 18.7 |
| 2019-20 | 380 | 92 | 24.21 |
As you can see, 2018-19 saw an incredibly low number of draws, making it a bad season for the bookies. This included an incredible run of 33 games without a draw (this was extended to 34 games before several draws in the next round of 3pm kick-offs).
That run and strange season led some to posit that the reduced frequency of draws was “evidence of a growing disparity between the ‘big six’ and the ‘rest’ of the Premier League teams,” and that we would regularly see seasons with fewer draws than the historical norm.
The next season though showed such a theory was perhaps discredited when we experienced more than 24% of matches end in ties. Indeed, in the six seasons considered above, whilst we saw the draw percentage vary wildly (from less than 19% to over 28%), the average was 23.95%. That figure is very much in keeping with both the overall historical averages and more recent trends. As such, we feel it is pretty safe to say that in general around one in four games will end in a draw.
What About Other Countries?

The picture is broadly the same when we consider other nations too. Analysis of 10 seasons of Europe’s big five leagues (Premier League, La Liga, Serie A, Bundesliga and Ligue 1) shows that 1-1 was the most common score of all. French football saw more draws than the other four leagues but when it comes to Germany, Spain, England and Italy there is a tight statistical grouping, with the four leagues only varying between a low of 11.5% of matches ending 1-1 and a high of 12.3% (in France 14.1% of games in this period ended in a 1-1 draw).
A 1-0 or 2-1 home win was the second most common result in all five leagues, with a 0-0 draw generally next. Again, Ligue 1 was an outlier with 11.1% of matches finishing in a bore draw, compared to a range of 6.7%-8.7% across the other four.
The table below shows the frequency of 0-0, 1-1 and 2-2 draws, once again illustrating that there is little difference on average in how often teams draw, at least when we keep our focus only on the major European leagues.
| Score | PL | Liga | Serie A | Bundesliga | Ligue 1 | Big 5 Average |
|---|---|---|---|---|---|---|
| 0-0 | 8.5% | 7.2% | 8.7% | 6.7% | 11.1% | 8.5% |
| 1-1 | 11.5% | 12.5% | 11.7% | 11.8% | 12% | 12.4% |
| 2-2 | 5% | 4% | 5.7% | 5.5% | 4.3% | 4.9% |
| Total draws (0-0,1-1 or 2-2) | 25% | 23.7% | 26.1% | 24% | 27.4% | 25.8% |
Is A Draw A Good Bet?
 Unfortunately, betting isn’t as easy as being able to make blanket statements about any given market or selection being a good bet per se. If it was, there would be fewer bookies on the Rich List and more punters with swimming pools in their gardens. Whilst we can look at how often the draw occurs and compare that to the average odds, this simple equation isn’t overly useful.
If you are interested, however, the average odds offered for a draw are usually around 9/4 (3.25 in decimal odds). Of course, this varies slightly depending on the league, bookmaker and season we look at, but that is a good average overall.
“Fair” odds for an outcome that we can expect to happen 25% of the time, or once every four matches, are 3/1, or 4.0 in decimal odds. Based on these two simple stats it would certainly seem safe to say that backing the draw is not a good bet.
That said, the bookie includes a margin for themselves in any odds they quote, known as the overround. This can range from just a few percent up to 20% or more, with that higher figure more or less accounting for the difference in the average odds and the ones that probabilities suggest would be fair.
Even so, and despite the fact that draw tends to be a lucrative result for the bookies, in terms of simple averages, backing the draw in every game is not going to work out well for the punter.
Other Options For Backing The Draw
 If you are interested in betting on a draw it is worth being aware of the many other markets you can opt for. All of the best football betting sites offer a massive number of different bets and many are worth bearing in mind if you think the game will end with the scores level. These alternative bets allow you to back the draw but to do so in a way that either increases your odds or decreases your risk.
The major options are listed below, although with football being the number one betting sport, there are a range of other markets also worth checking out at your favourite bookmaker.
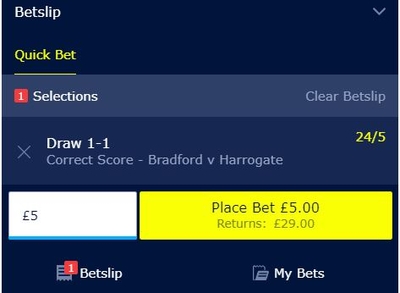
- Correct score – increase the odds by backing a specific score, such as 1-1 or 3-3
- No goalscorer – if you fancy the game will end 0-0 then “No Goalscorer” often has the same odds as the correct score option but also pays out if there are only own goals scored in the game
- Half time result – around 43% of games are level at half time so back the HT draw for safer option
- Half time correct score – about 32% of games are 0-0 at the break, with a further 11% being 1-1
- Half time/full time – for longer odds you can back options such as draw/draw, home team/draw or away team/draw in this market where you must predict the result after 45 minutes and also at full time
As with all bets, to improve your chances of making money in the long run you really need to research each game individually. There are lots of different ways to back the draw and related outcomes but a blanket approach relying on fairly basic stats is unlikely to yield great results.
One of the best times to back a draw is towards the end of the season or the group phase of a competition at a time when it is a result that suits both teams. The odds will usually be low but if you can spot such a scenario early, you may just be ahead of the game and grab yourself some real value.