
 Depending on where you stand, you might view expected goals (xG) as an insightful statistical measure or an overly scientific waste of time. The rather rapid rise of xG to mainstream football analysis has certainly divided opinion along the way.
Whether you value the metric or not, it looks like xG is not going away anytime soon. As such in this article, we’ll be explaining exactly what the expected goals statistic is and what it tells us.
We shall also examine some of the limitations of xG models. Although there are some limitations, as it is by no means a flawless metric, some of its criticisms come from a limited understanding of what the data represent.
For those that know exactly what the xG figures show, most would agree that it has definite value and it is a tool that can even aid your betting selections.
Expected Goals – Why Is It Needed?
Before discussing how expected goals works, we should first ask why are we bothering with it at all? Are shots on target and off target not sufficient for giving us an indication of which side has been the more potent in attack over the course of 90 minutes? Measuring shots is often a good indicator of judging the ‘best’ team but it is by no means perfect. Let us highlight the limitations of relying solely on more traditional stats through a couple of examples.
The first game we wanted to highlight was a Premier League contest between Tottenham and Leicester played on 19th July 2021. The stats are as follows.
| Stat | Tottenham | Leicester |
|---|---|---|
| Possession | 29% | 71% |
| Shots | 7 | 24 |
| Shots on Target | 3 | 6 |
| Corners | 4 | 13 |
Judging by these stats alone, you would think Leicester won the game comfortably when in actual fact they lost 3-0. Spurs raced into this commanding lead after 40 minutes and then effectively set up a brick wall, forcing Leicester into many speculative efforts from outside the box or from tight angles. Eleven of the Foxes’ attempts came from outside the box and this meant their xG only went as high as 1.20, an average of 0.05 per effort.
Another example comes from a clash between Manchester City and Crystal Palace during the 2020/21 season. The Citizens were the strong favourites for the fixture and a look at the stats suggests that the game went completely as expected.
| Stat | Man City | Crystal Palace |
|---|---|---|
| Goals | 4 | 0 |
| Possession | 72% | 28% |
| Shots | 13 | 2 |
| Shots on Target | 6 | 0 |
| Corners | 11 | 1 |
Nothing untoward here but xG actually paints a distinctly different picture of this game. City’s expected goal’s totalled just 0.96 meaning they were outrageously clinical during this contest. Given the quality of chances they had it would have been more likely that they would have won the game just 1-0, or even been involved in a goalless draw.
What Does xG Show?
 Traditionalists among you might say that the only number that matters is goals and in a sense this is true. Expected goals, is definitely a statistic many find interesting though as it helps give a better sense of how competitive a match was. It does this by awarding a score for every single shot taken during a game. The score awarded depends not on the quality of the shot itself but the quality of the opportunity.
The lowest score issued is 0.01 and this could be, for example, an effort from 40 yards out from a tight angle that would very rarely trouble a goalkeeper. An absolute sitter on the other hand could give an xG of 0.8 or 0.9. In theory, the maximum score is 0.99 as 1 would imply a certain goal, something which does not exist. The numbers directly represent the likelihood of a certain chance being converted. If a striker has a shot with an xG of 0.4, this means that they would be expected to score it 40% of the time. It does not necessarily mean this one-off strike has a 40% chance of success however because the quality of the striker and goalkeeper also makes a difference.
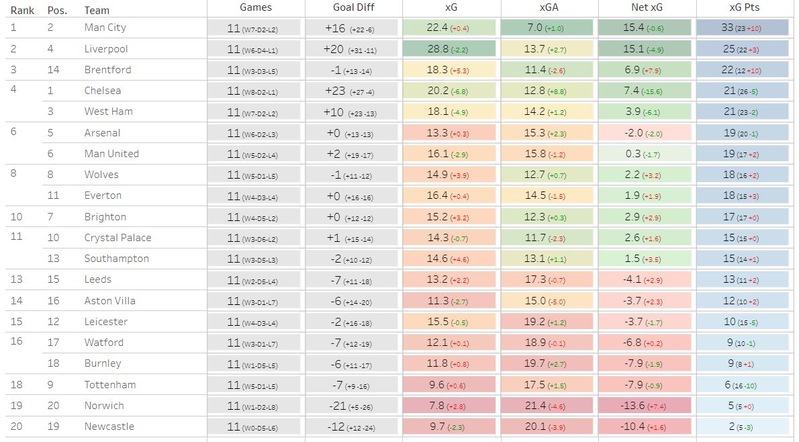
By totting up how presentable each shot was, this will produce a team score for each game. Overall, there is a good correlation between actual goals scored and the xG. Take a look at any week and you will see this is the case. For an illustration though, here is gameweek 11 of the 2021/22 Premier League season.
| Team | xG | Actual Goals | Actual Goals | xG | Team |
|---|---|---|---|---|---|
| Southampton | 0.9 | 1 | 0 | 0.54 | Aston Villa |
| Man United | 0.76 | 0 | 2 | 2.04 | Man City |
| Brentford | 2.79 | 1 | 2 | 1.16 | Norwich |
| Chelsea | 3.01 | 1 | 1 | 0.67 | Burnley |
| Crystal Palace | 2.65 | 2 | 0 | 0.25 | Wolves |
| Brighton | 1.43 | 1 | 1 | 0.23 | Newcastle |
| Arsenal | 1.49 | 1 | 0 | 0.49 | Watford |
| Everton | 0.60 | 0 | 0 | 0.80 | Spurs |
| Leeds | 1.97 | 1 | 1 | 0.80 | Leicester |
| West Ham | 1.25 | 3 | 2 | 1.46 | Liverpool |
From this information, we can see that most teams were within a goal of their xG with the exceptions of Brentford and Chelsea who were wasteful and West Ham who were helped out by an own goal. Chelsea fans in particular can feel a little aggrieved that their team did not bag all three points but they happened to find Nick Pope in inspired form.
How Is xG Calculated?
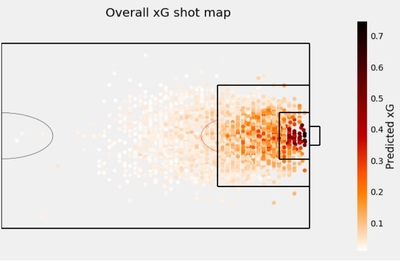
We know that xG represents how good a shooting opportunity is, but how exactly are the figures produced? Well, xG uses masses of data to find out, historically, how often players have scored from incredibly similar situations. Opta, for instance, uses 300,000 shots for their own xG model so it is not simply a case of someone awarding a subjective rating while watching the game. An xG model will typically take into consideration the assist type, the shot type (so header, volley, and so on), distance from the goal, angle to the goal and the positioning of defenders.
It is important at this stage to note that there is not simply one ‘xG’ calculation, like with shots on target, as models do vary. The figures used in the article are provided by Understat but there are several other supplies such as Opta, Infogol and StatsBomb. In the case of StatsBomb, they made a significant adjustment to their xG model in 2020 as it began factoring in ‘shot impact height’ which is the height of the ball at the time of the shot.
It is therefore possible to see xG figures that differ depending on the source. For most shots though, they tend to produce very similar numbers.
Player xG
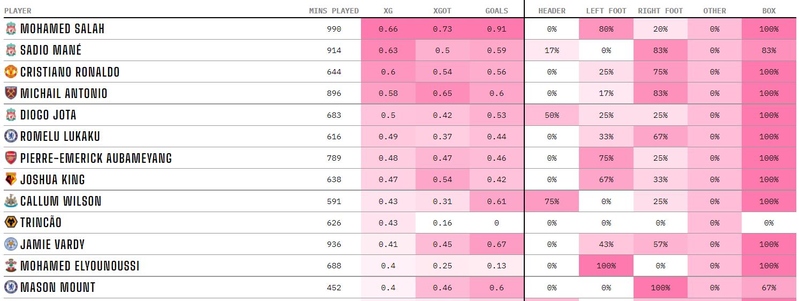
People will say that xG is flawed because it does not take into account the quality of the person taking the shot. Robert Lewandowski would produce the same xG for taking a penalty as would Manuel Neuer. To consider this to be a flaw though is a misunderstanding of what xG is there to show. Expected goals is designed to tell you the chances of a (statistically) average player scoring in that position. Through this, you can then see which players are especially clinical and which are extremely wasteful.
In the 2020/21 Premier League season the most clinical player was Heung-Min Son who scored 16 goals despite an xG of just 11.02. This was the fifth season in the row the Korean had outperformed his xG in the league, with a total overperformance of 18.13 goals. By being so consistently a better finisher than average gives us ‘proof’ that he is among the best finishers in the world.
By contrast, Timo Werner ended the same season with a -7.43 under performance, making him the most wasteful player in the division. This was surprising to see given that he had been extremely accurate in front of goal with RB Leipzig the season prior. Other players seem to be consistently inaccurate when shooting such as Manchester City’s Gabriel Jesus as the league performances below show.
| Season | Expected Goals | Actual Goals |
|---|---|---|
| 2020/21 | 9.65 | 9 |
| 2019/20 | 21.02 | 14 |
| 2018/19 | 12.62 | 7 |
| 2017/18 | 15.37 | 13 |
| 2016/17 | 7.24 | 7 |
Only thanks to xG do we have clear, objective evidence that Jesus is a wasteful player when shooting. Of course, anyone who watched his regularly could tell you this also but it helps to have more concrete proof.
Limitation of xG
While the inability to factor in player quality is not, we would argue, a flaw of xG, this does not mean the metric is perfect. One significant issue it has is the inability to fully take into account the context of the shot. For the vast majority of shots, this is not an issue but xG can sometimes significantly underplays how presentable a chance is, often when a keeper is not in their usual position.
Take a look at the example below in which Jesse Lingard basically has an open goal tap in after tackling Kasper Schmeichel in the Leicester net. At the time Lingard shoots, it would take a huge error on his part not to direct the ball into an empty net.
You would probably expect this to have had an xG of 0.95 or similar but it only went down as 0.35 because of the distance between Lingard and the goal.
Even when a striker shoots much closer though, the xG still does not give a completely fair representation.
In the example below, Alvaro Negredo tricked the last defender into committing, resulting in the Spaniard having almost the full goalmouth to aim at.
You would probably back a toddler scoring from here but even so the xG was only 0.61.
Another limitation of xG is its inability to account for a very presentable chance that did not result in a shot.
Look at the example below in which Steve Mounie was racing clear in on goal against Crystal Palace.
His decision to slow down to prepare himself for a shot, allowed Timothy Fonsu-Mensah to get a tackle in before he could pull the trigger.
Subsequently, there was no xG to record as no shot was taken.
You will also have crosses, which are just a whisker away from being converted, not recorded on any xG model.
There are plenty such examples but here is one when Spurs hosted Watford early in the 2021/22 season.
Lucas Moura drilled in a low cross that looked to be heading right for Harry Kane’s boot.
Rather than an easy tap in though, William Troost-Ekong’s slight touch narrowly diverted it away from the Englishman and the chance went begging.
Defender touches are never considered to be a shot (even if it’s an own goal) so again this was not an incident recorded by xG despite being inches from being a goal.
Lastly, and although this is not a weakness specifically of xG itself, it is not a metric that is very meaningful in the short term. Much like with any statistical model, a limited batch of data is not going to produce much in the way of reliable trends.
Say for instance we flipped a coin three times, there is a one in four chance of all three flips landing all tails or all heads. Say it was tails, you might conclude from this that tails is ‘better’ than heads, or the coin is rigged in tails’ favour. Making such a strong conclusion however would be foolish given the tiny sample. This applies to xG too which is best for seeing longer-term trends. Four games into the 2020/21 Premier League season, Brighton were outperforming their xG by 0.54, so converting a little better than average. By the end of the campaign, they had underperformed by 13.82 goals.
Expected Goals and Betting

As xG does not give us a reliable indication of which teams are clinical and which are wasteful until a little later in the season, it is not something that can always shape your bets. In some instances, it can be a useful metric though, providing you do not rely on it solely. Say for instance you wanted to bet on the 2020/21 Premier League top goalscorer. Pierre-Emerick Aubameyang had netted 22 goals the season prior, putting him just one goal away from the golden boot.
That season though the Gabonese forward hugely outperformed his xG, to a much larger extent (5.65) than anything managed previously. The most clinical season outside of this was two years before in which he outperformed the xG by just 0.83. It was reasonable to assume then that the Arsenal man would not be as clinical the following season. This is not the only consideration for a top goalscorer bet of course, but it is something well worth considering. As it happened, the 6/1 second-favourite only ended up scoring 10 goals that year.
You can also use xG to help find value in individual matches in some cases. Take for instance West Ham’s game against Tottenham on 24th October 2021. Coming into the game Spurs had one more point than West Ham but six fewer goals scored and an xG almost six lower too, indicating there was a very real gap in the team’s attacking threats. Despite this, the Hammers, who hosted the match, were priced at a generous price of 13/10. The east Londoners did go on to win the match 1-0 with Spurs performing very much as they had so far that season, registering an xG of just 0.67.
Of course, there will be games in which the team with the much lower xG goes on to win but there is no such thing as a certainty in betting. What looking at xG can do, however, is help you to find instances of good value. By placing ‘good value’ bets enough times, you may be able to record a long-term net win. Having said that, the bookies are also aware of the xG stats, so attempting to find value in this way will be tough, especially for the biggest games.